Plot missings and class with apexcharter
Examples
data_demo <- mtcars
data_demo[2:4, "cyl"] <- NA
rbind(data_demo, data_demo, data_demo, data_demo) |> missings_apex_plot()
#> Called from: missings_apex_plot(rbind(data_demo, data_demo, data_demo, data_demo))
#> debug: df_plot <- purrr::map_df(data, function(x) {
#> ifelse(is.na(x), yes = NA, no = glue::glue_collapse(class(x),
#> sep = "\n"))
#> }) %>% dplyr::mutate(rows = dplyr::row_number()) %>% tidyr::pivot_longer(cols = -rows,
#> names_to = "variable", values_to = "valueType", values_transform = list(valueType = as.character)) %>%
#> dplyr::arrange(rows, variable, valueType)
#> Error in purrr::map_df(data, function(x) { ifelse(is.na(x), yes = NA, no = glue::glue_collapse(class(x), sep = "\n"))}) %>% dplyr::mutate(rows = dplyr::row_number()) %>% tidyr::pivot_longer(cols = -rows, names_to = "variable", values_to = "valueType", values_transform = list(valueType = as.character)) %>% dplyr::arrange(rows, variable, valueType): could not find function "%>%"
data_demo |> missings_apex_plot()
#> Called from: missings_apex_plot(data_demo)
#> debug: df_plot <- purrr::map_df(data, function(x) {
#> ifelse(is.na(x), yes = NA, no = glue::glue_collapse(class(x),
#> sep = "\n"))
#> }) %>% dplyr::mutate(rows = dplyr::row_number()) %>% tidyr::pivot_longer(cols = -rows,
#> names_to = "variable", values_to = "valueType", values_transform = list(valueType = as.character)) %>%
#> dplyr::arrange(rows, variable, valueType)
#> Error in purrr::map_df(data, function(x) { ifelse(is.na(x), yes = NA, no = glue::glue_collapse(class(x), sep = "\n"))}) %>% dplyr::mutate(rows = dplyr::row_number()) %>% tidyr::pivot_longer(cols = -rows, names_to = "variable", values_to = "valueType", values_transform = list(valueType = as.character)) %>% dplyr::arrange(rows, variable, valueType): could not find function "%>%"
mtcars |> missings_apex_plot(animation = TRUE)
#> Called from: missings_apex_plot(mtcars, animation = TRUE)
#> debug: df_plot <- purrr::map_df(data, function(x) {
#> ifelse(is.na(x), yes = NA, no = glue::glue_collapse(class(x),
#> sep = "\n"))
#> }) %>% dplyr::mutate(rows = dplyr::row_number()) %>% tidyr::pivot_longer(cols = -rows,
#> names_to = "variable", values_to = "valueType", values_transform = list(valueType = as.character)) %>%
#> dplyr::arrange(rows, variable, valueType)
#> Error in purrr::map_df(data, function(x) { ifelse(is.na(x), yes = NA, no = glue::glue_collapse(class(x), sep = "\n"))}) %>% dplyr::mutate(rows = dplyr::row_number()) %>% tidyr::pivot_longer(cols = -rows, names_to = "variable", values_to = "valueType", values_transform = list(valueType = as.character)) %>% dplyr::arrange(rows, variable, valueType): could not find function "%>%"
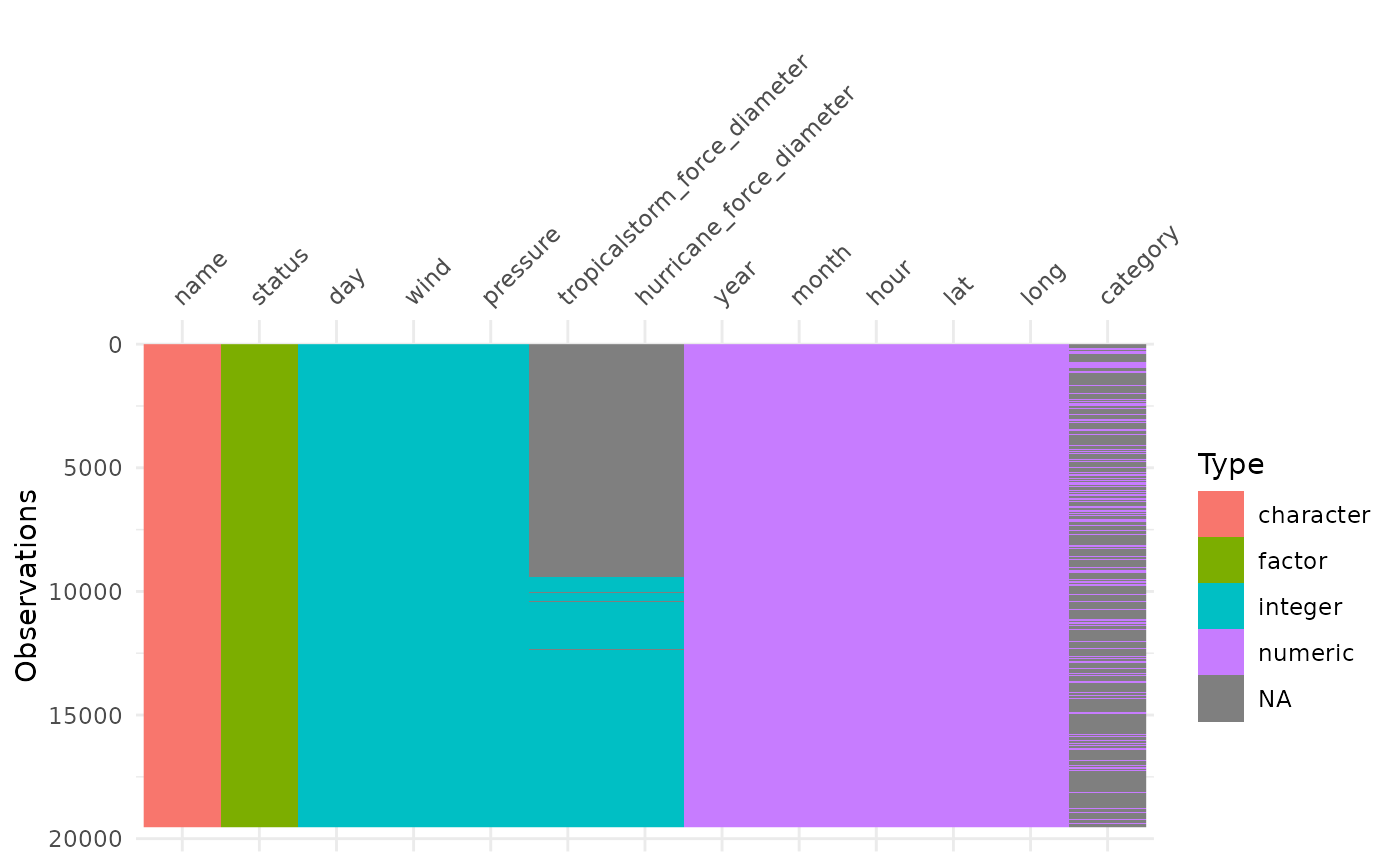
# dplyr::storms |> missings_apex_plot()
visdat::vis_dat(dplyr::storms)