Data correlations evaluation module
Source:R/data_plots.R, R/plot_box.R, R/plot_hbar.R, and 4 more
data-plots.RdData correlations evaluation module
Wrapper to create plot based on provided type
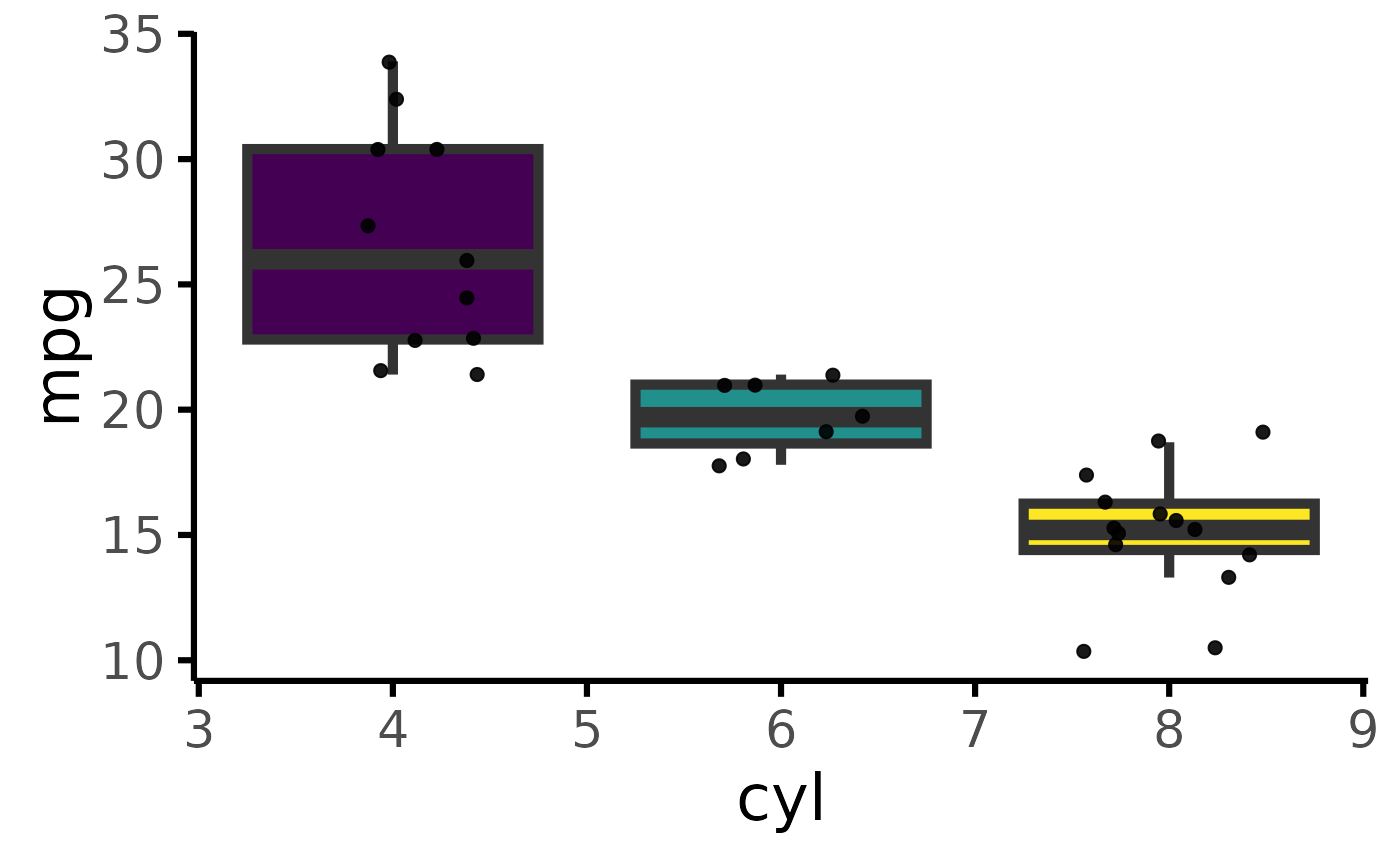
Beautiful box plot(s)
Create nice box-plots
Nice horizontal stacked bars (Grotta bars)
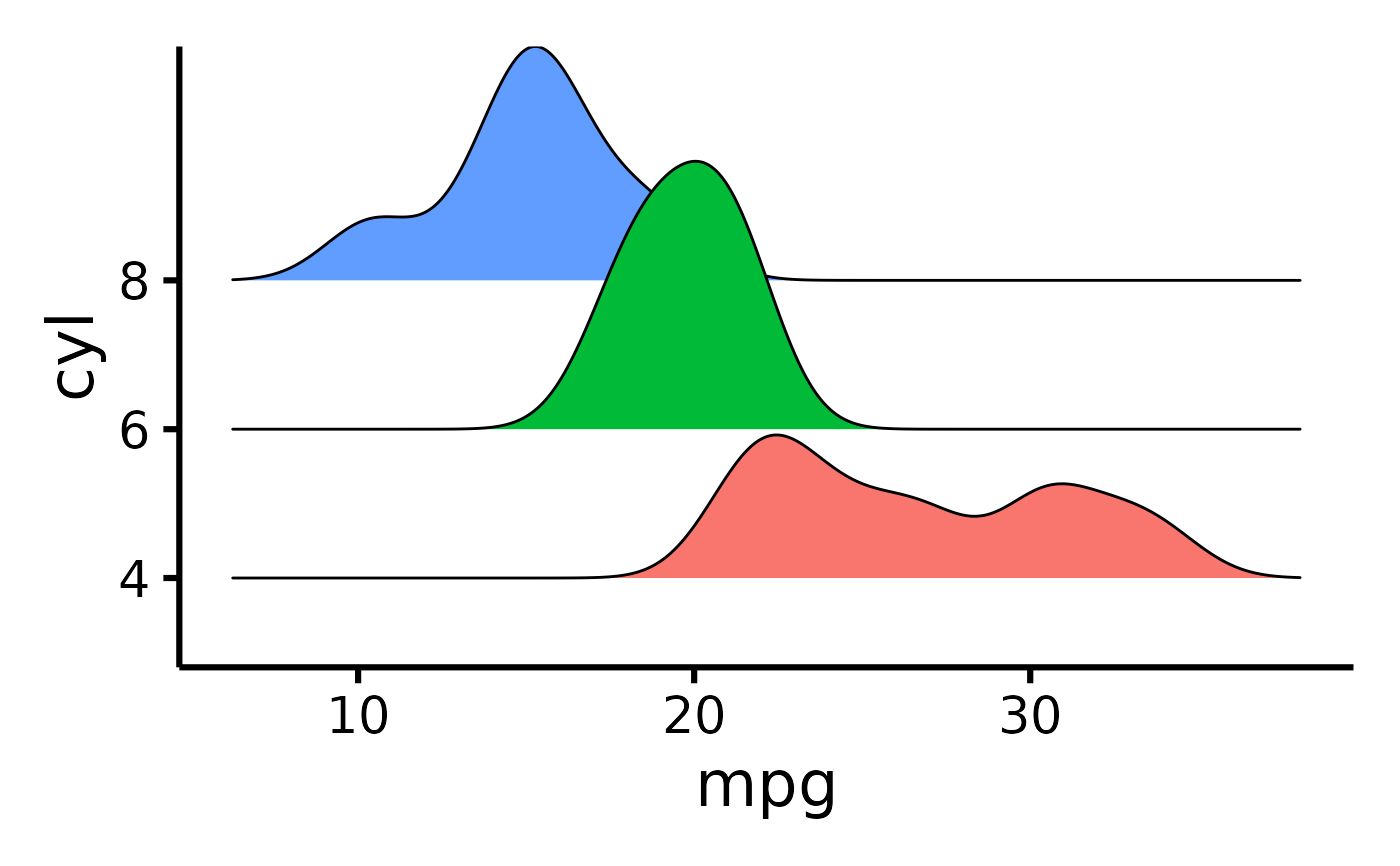
Plot nice ridge plot
Readying data for sankey plot
Beautiful sankey plot with option to split by a tertiary group
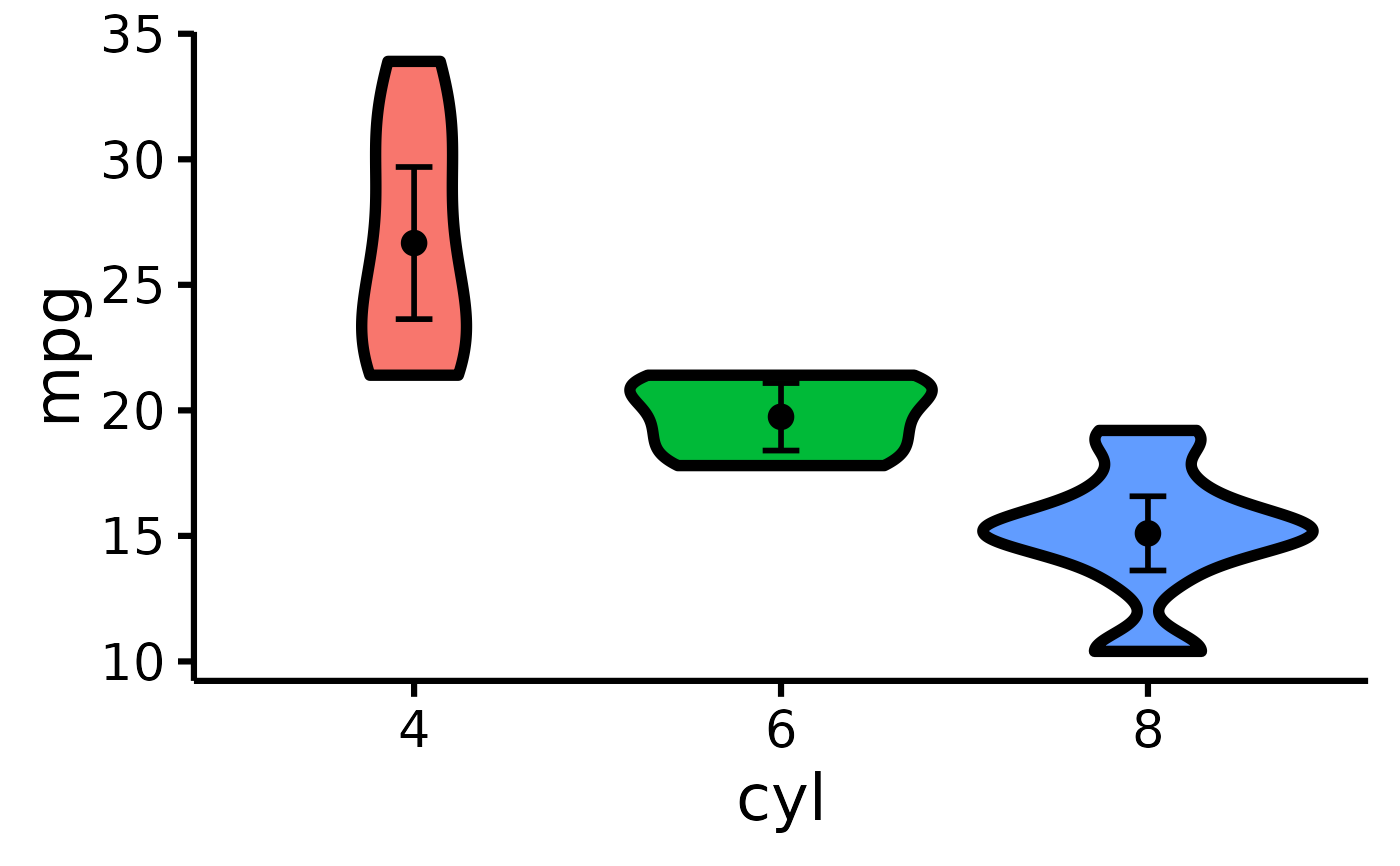
Beautiful violin plot
Beatiful violin plot
Usage
data_visuals_ui(id, tab_title = "Plots", ...)

data_visuals_server(id, data, ...)

create_plot(data, type, x, y, z = NULL, ...)

plot_box(data, x, y, z = NULL)

plot_box_single(data, x, y = NULL, seed = 2103)

plot_hbars(data, x, y, z = NULL)

plot_ridge(data, x, y, z = NULL, ...)

sankey_ready(data, x, y, numbers = "count", ...)

plot_sankey(data, x, y, z = NULL, color.group = "x", colors = NULL)

plot_scatter(data, x, y, z = NULL)

plot_violin(data, x, y, z = NULL)Value
Shiny ui module
shiny server module
ggplot2 object
ggplot2 object
ggplot object
ggplot2 object
ggplot2 object
data.frame
ggplot2 object
ggplot2 object
ggplot2 object
Examples
create_plot(mtcars, "plot_violin", "mpg", "cyl")
#> [[1]]
 #>
#> attr(,"code")
#> FreesearchR::plot_violin(pri = "mpg", sec = "cyl", ter = NULL)
mtcars |> plot_box(x = "mpg", y = "cyl", z = "gear")
#> Error in plot_box(mtcars, x = "mpg", y = "cyl", z = "gear"): unused arguments (x = "mpg", y = "cyl", z = "gear")
mtcars |>
default_parsing() |>
plot_box(x = "mpg", y = "cyl", z = "gear")
#> Error in plot_box(default_parsing(mtcars), x = "mpg", y = "cyl", z = "gear"): unused arguments (x = "mpg", y = "cyl", z = "gear")
mtcars |> plot_box_single("mpg","cyl")
#>
#> attr(,"code")
#> FreesearchR::plot_violin(pri = "mpg", sec = "cyl", ter = NULL)
mtcars |> plot_box(x = "mpg", y = "cyl", z = "gear")
#> Error in plot_box(mtcars, x = "mpg", y = "cyl", z = "gear"): unused arguments (x = "mpg", y = "cyl", z = "gear")
mtcars |>
default_parsing() |>
plot_box(x = "mpg", y = "cyl", z = "gear")
#> Error in plot_box(default_parsing(mtcars), x = "mpg", y = "cyl", z = "gear"): unused arguments (x = "mpg", y = "cyl", z = "gear")
mtcars |> plot_box_single("mpg","cyl")
 mtcars |> plot_hbars(x = "carb", y = "cyl")
#> Error in plot_hbars(mtcars, x = "carb", y = "cyl"): unused arguments (x = "carb", y = "cyl")
mtcars |> plot_hbars(x = "carb", y = NULL)
#> Error in plot_hbars(mtcars, x = "carb", y = NULL): unused arguments (x = "carb", y = NULL)
mtcars |>
default_parsing() |>
plot_ridge(x = "mpg", y = "cyl")
#> Picking joint bandwidth of 1.38
mtcars |> plot_hbars(x = "carb", y = "cyl")
#> Error in plot_hbars(mtcars, x = "carb", y = "cyl"): unused arguments (x = "carb", y = "cyl")
mtcars |> plot_hbars(x = "carb", y = NULL)
#> Error in plot_hbars(mtcars, x = "carb", y = NULL): unused arguments (x = "carb", y = NULL)
mtcars |>
default_parsing() |>
plot_ridge(x = "mpg", y = "cyl")
#> Picking joint bandwidth of 1.38
 mtcars |> plot_ridge(x = "mpg", y = "cyl", z = "gear")
#> Picking joint bandwidth of 1.52
#> Warning: The following aesthetics were dropped during statistical transformation: y and
#> fill.
#> ℹ This can happen when ggplot fails to infer the correct grouping structure in
#> the data.
#> ℹ Did you forget to specify a `group` aesthetic or to convert a numerical
#> variable into a factor?
#> Error in ggridges::geom_density_ridges(): Problem while setting up geom.
#> ℹ Error occurred in the 1st layer.
#> Caused by error in `compute_geom_1()`:
#> ! `geom_density_ridges()` requires the following missing aesthetics: y.
ds <- data.frame(g = sample(LETTERS[1:2], 100, TRUE), first = REDCapCAST::as_factor(sample(letters[1:4], 100, TRUE)), last = sample(c(letters[1:4], NA), 100, TRUE, prob = c(rep(.23, 4), .08)))
ds |> sankey_ready("first", "last")
#> # A tibble: 19 × 7
#> first last n gx.sum gy.sum lx ly
#> <fct> <fct> <int> <int> <int> <fct> <fct>
#> 1 d d 11 36 18 "d\n(n=36)" "d\n(n=18)"
#> 2 d a 11 36 30 "d\n(n=36)" "a\n(n=30)"
#> 3 d b 6 36 25 "d\n(n=36)" "b\n(n=25)"
#> 4 d c 8 36 22 "d\n(n=36)" "c\n(n=22)"
#> 5 c d 3 24 18 "c\n(n=24)" "d\n(n=18)"
#> 6 c a 7 24 30 "c\n(n=24)" "a\n(n=30)"
#> 7 c b 10 24 25 "c\n(n=24)" "b\n(n=25)"
#> 8 c c 1 24 22 "c\n(n=24)" "c\n(n=22)"
#> 9 c NA 3 24 5 "c\n(n=24)" NA
#> 10 b d 2 17 18 "b\n(n=17)" "d\n(n=18)"
#> 11 b a 4 17 30 "b\n(n=17)" "a\n(n=30)"
#> 12 b b 3 17 25 "b\n(n=17)" "b\n(n=25)"
#> 13 b c 7 17 22 "b\n(n=17)" "c\n(n=22)"
#> 14 b NA 1 17 5 "b\n(n=17)" NA
#> 15 a d 2 23 18 "a\n(n=23)" "d\n(n=18)"
#> 16 a a 8 23 30 "a\n(n=23)" "a\n(n=30)"
#> 17 a b 6 23 25 "a\n(n=23)" "b\n(n=25)"
#> 18 a c 6 23 22 "a\n(n=23)" "c\n(n=22)"
#> 19 a NA 1 23 5 "a\n(n=23)" NA
ds |> sankey_ready("first", "last", numbers = "percentage")
#> # A tibble: 19 × 7
#> first last n gx.sum gy.sum lx ly
#> <fct> <fct> <int> <int> <int> <fct> <fct>
#> 1 d d 11 36 18 "d\n(36%)" "d\n(18%)"
#> 2 d a 11 36 30 "d\n(36%)" "a\n(30%)"
#> 3 d b 6 36 25 "d\n(36%)" "b\n(25%)"
#> 4 d c 8 36 22 "d\n(36%)" "c\n(22%)"
#> 5 c d 3 24 18 "c\n(24%)" "d\n(18%)"
#> 6 c a 7 24 30 "c\n(24%)" "a\n(30%)"
#> 7 c b 10 24 25 "c\n(24%)" "b\n(25%)"
#> 8 c c 1 24 22 "c\n(24%)" "c\n(22%)"
#> 9 c NA 3 24 5 "c\n(24%)" NA
#> 10 b d 2 17 18 "b\n(17%)" "d\n(18%)"
#> 11 b a 4 17 30 "b\n(17%)" "a\n(30%)"
#> 12 b b 3 17 25 "b\n(17%)" "b\n(25%)"
#> 13 b c 7 17 22 "b\n(17%)" "c\n(22%)"
#> 14 b NA 1 17 5 "b\n(17%)" NA
#> 15 a d 2 23 18 "a\n(23%)" "d\n(18%)"
#> 16 a a 8 23 30 "a\n(23%)" "a\n(30%)"
#> 17 a b 6 23 25 "a\n(23%)" "b\n(25%)"
#> 18 a c 6 23 22 "a\n(23%)" "c\n(22%)"
#> 19 a NA 1 23 5 "a\n(23%)" NA
data.frame(
g = sample(LETTERS[1:2], 100, TRUE),
first = REDCapCAST::as_factor(sample(letters[1:4], 100, TRUE)),
last = sample(c(TRUE, FALSE, FALSE), 100, TRUE)
) |>
sankey_ready("first", "last")
#> # A tibble: 8 × 7
#> first last n gx.sum gy.sum lx ly
#> <fct> <fct> <int> <int> <int> <fct> <fct>
#> 1 b FALSE 16 29 66 "b\n(n=29)" "FALSE\n(n=66)"
#> 2 b TRUE 13 29 34 "b\n(n=29)" "TRUE\n(n=34)"
#> 3 a FALSE 18 25 66 "a\n(n=25)" "FALSE\n(n=66)"
#> 4 a TRUE 7 25 34 "a\n(n=25)" "TRUE\n(n=34)"
#> 5 d FALSE 13 20 66 "d\n(n=20)" "FALSE\n(n=66)"
#> 6 d TRUE 7 20 34 "d\n(n=20)" "TRUE\n(n=34)"
#> 7 c FALSE 19 26 66 "c\n(n=26)" "FALSE\n(n=66)"
#> 8 c TRUE 7 26 34 "c\n(n=26)" "TRUE\n(n=34)"
ds <- data.frame(g = sample(LETTERS[1:2], 100, TRUE), first = REDCapCAST::as_factor(sample(letters[1:4], 100, TRUE)), last = REDCapCAST::as_factor(sample(letters[1:4], 100, TRUE)))
ds |> plot_sankey("first", "last")
#> Error in match.arg(color.group): 'arg' should be one of “pri”, “sec”
ds |> plot_sankey("first", "last", color.group = "y")
#> Error in match.arg(color.group): 'arg' should be one of “pri”, “sec”
ds |> plot_sankey("first", "last", z = "g", color.group = "y")
#> Error in plot_sankey(ds, "first", "last", z = "g", color.group = "y"): unused argument (z = "g")
mtcars |> plot_scatter(x = "mpg", y = "wt")
#> Error in plot_scatter(mtcars, x = "mpg", y = "wt"): unused arguments (x = "mpg", y = "wt")
mtcars |> plot_violin(x = "mpg", y = "cyl", z = "gear")
#> Error in plot_violin(mtcars, x = "mpg", y = "cyl", z = "gear"): unused arguments (x = "mpg", y = "cyl", z = "gear")
mtcars |> plot_ridge(x = "mpg", y = "cyl", z = "gear")
#> Picking joint bandwidth of 1.52
#> Warning: The following aesthetics were dropped during statistical transformation: y and
#> fill.
#> ℹ This can happen when ggplot fails to infer the correct grouping structure in
#> the data.
#> ℹ Did you forget to specify a `group` aesthetic or to convert a numerical
#> variable into a factor?
#> Error in ggridges::geom_density_ridges(): Problem while setting up geom.
#> ℹ Error occurred in the 1st layer.
#> Caused by error in `compute_geom_1()`:
#> ! `geom_density_ridges()` requires the following missing aesthetics: y.
ds <- data.frame(g = sample(LETTERS[1:2], 100, TRUE), first = REDCapCAST::as_factor(sample(letters[1:4], 100, TRUE)), last = sample(c(letters[1:4], NA), 100, TRUE, prob = c(rep(.23, 4), .08)))
ds |> sankey_ready("first", "last")
#> # A tibble: 19 × 7
#> first last n gx.sum gy.sum lx ly
#> <fct> <fct> <int> <int> <int> <fct> <fct>
#> 1 d d 11 36 18 "d\n(n=36)" "d\n(n=18)"
#> 2 d a 11 36 30 "d\n(n=36)" "a\n(n=30)"
#> 3 d b 6 36 25 "d\n(n=36)" "b\n(n=25)"
#> 4 d c 8 36 22 "d\n(n=36)" "c\n(n=22)"
#> 5 c d 3 24 18 "c\n(n=24)" "d\n(n=18)"
#> 6 c a 7 24 30 "c\n(n=24)" "a\n(n=30)"
#> 7 c b 10 24 25 "c\n(n=24)" "b\n(n=25)"
#> 8 c c 1 24 22 "c\n(n=24)" "c\n(n=22)"
#> 9 c NA 3 24 5 "c\n(n=24)" NA
#> 10 b d 2 17 18 "b\n(n=17)" "d\n(n=18)"
#> 11 b a 4 17 30 "b\n(n=17)" "a\n(n=30)"
#> 12 b b 3 17 25 "b\n(n=17)" "b\n(n=25)"
#> 13 b c 7 17 22 "b\n(n=17)" "c\n(n=22)"
#> 14 b NA 1 17 5 "b\n(n=17)" NA
#> 15 a d 2 23 18 "a\n(n=23)" "d\n(n=18)"
#> 16 a a 8 23 30 "a\n(n=23)" "a\n(n=30)"
#> 17 a b 6 23 25 "a\n(n=23)" "b\n(n=25)"
#> 18 a c 6 23 22 "a\n(n=23)" "c\n(n=22)"
#> 19 a NA 1 23 5 "a\n(n=23)" NA
ds |> sankey_ready("first", "last", numbers = "percentage")
#> # A tibble: 19 × 7
#> first last n gx.sum gy.sum lx ly
#> <fct> <fct> <int> <int> <int> <fct> <fct>
#> 1 d d 11 36 18 "d\n(36%)" "d\n(18%)"
#> 2 d a 11 36 30 "d\n(36%)" "a\n(30%)"
#> 3 d b 6 36 25 "d\n(36%)" "b\n(25%)"
#> 4 d c 8 36 22 "d\n(36%)" "c\n(22%)"
#> 5 c d 3 24 18 "c\n(24%)" "d\n(18%)"
#> 6 c a 7 24 30 "c\n(24%)" "a\n(30%)"
#> 7 c b 10 24 25 "c\n(24%)" "b\n(25%)"
#> 8 c c 1 24 22 "c\n(24%)" "c\n(22%)"
#> 9 c NA 3 24 5 "c\n(24%)" NA
#> 10 b d 2 17 18 "b\n(17%)" "d\n(18%)"
#> 11 b a 4 17 30 "b\n(17%)" "a\n(30%)"
#> 12 b b 3 17 25 "b\n(17%)" "b\n(25%)"
#> 13 b c 7 17 22 "b\n(17%)" "c\n(22%)"
#> 14 b NA 1 17 5 "b\n(17%)" NA
#> 15 a d 2 23 18 "a\n(23%)" "d\n(18%)"
#> 16 a a 8 23 30 "a\n(23%)" "a\n(30%)"
#> 17 a b 6 23 25 "a\n(23%)" "b\n(25%)"
#> 18 a c 6 23 22 "a\n(23%)" "c\n(22%)"
#> 19 a NA 1 23 5 "a\n(23%)" NA
data.frame(
g = sample(LETTERS[1:2], 100, TRUE),
first = REDCapCAST::as_factor(sample(letters[1:4], 100, TRUE)),
last = sample(c(TRUE, FALSE, FALSE), 100, TRUE)
) |>
sankey_ready("first", "last")
#> # A tibble: 8 × 7
#> first last n gx.sum gy.sum lx ly
#> <fct> <fct> <int> <int> <int> <fct> <fct>
#> 1 b FALSE 16 29 66 "b\n(n=29)" "FALSE\n(n=66)"
#> 2 b TRUE 13 29 34 "b\n(n=29)" "TRUE\n(n=34)"
#> 3 a FALSE 18 25 66 "a\n(n=25)" "FALSE\n(n=66)"
#> 4 a TRUE 7 25 34 "a\n(n=25)" "TRUE\n(n=34)"
#> 5 d FALSE 13 20 66 "d\n(n=20)" "FALSE\n(n=66)"
#> 6 d TRUE 7 20 34 "d\n(n=20)" "TRUE\n(n=34)"
#> 7 c FALSE 19 26 66 "c\n(n=26)" "FALSE\n(n=66)"
#> 8 c TRUE 7 26 34 "c\n(n=26)" "TRUE\n(n=34)"
ds <- data.frame(g = sample(LETTERS[1:2], 100, TRUE), first = REDCapCAST::as_factor(sample(letters[1:4], 100, TRUE)), last = REDCapCAST::as_factor(sample(letters[1:4], 100, TRUE)))
ds |> plot_sankey("first", "last")
#> Error in match.arg(color.group): 'arg' should be one of “pri”, “sec”
ds |> plot_sankey("first", "last", color.group = "y")
#> Error in match.arg(color.group): 'arg' should be one of “pri”, “sec”
ds |> plot_sankey("first", "last", z = "g", color.group = "y")
#> Error in plot_sankey(ds, "first", "last", z = "g", color.group = "y"): unused argument (z = "g")
mtcars |> plot_scatter(x = "mpg", y = "wt")
#> Error in plot_scatter(mtcars, x = "mpg", y = "wt"): unused arguments (x = "mpg", y = "wt")
mtcars |> plot_violin(x = "mpg", y = "cyl", z = "gear")
#> Error in plot_violin(mtcars, x = "mpg", y = "cyl", z = "gear"): unused arguments (x = "mpg", y = "cyl", z = "gear")