Beautiful sankey plot
Examples
ds <- data.frame(g = sample(LETTERS[1:2], 100, TRUE), first = REDCapCAST::as_factor(sample(letters[1:4], 100, TRUE)), last = REDCapCAST::as_factor(sample(letters[1:4], 100, TRUE)))
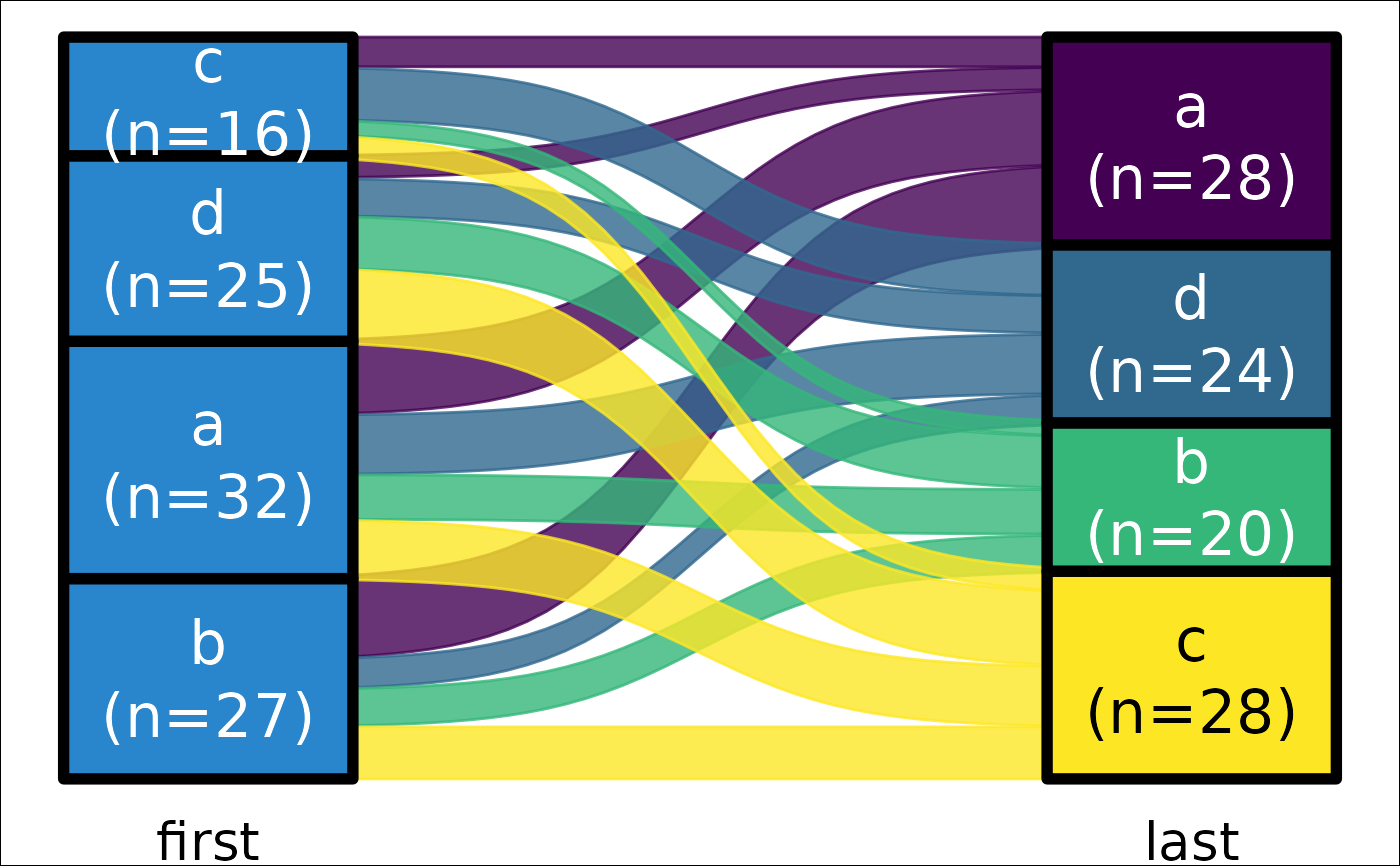
ds |> plot_sankey_single("first", "last")
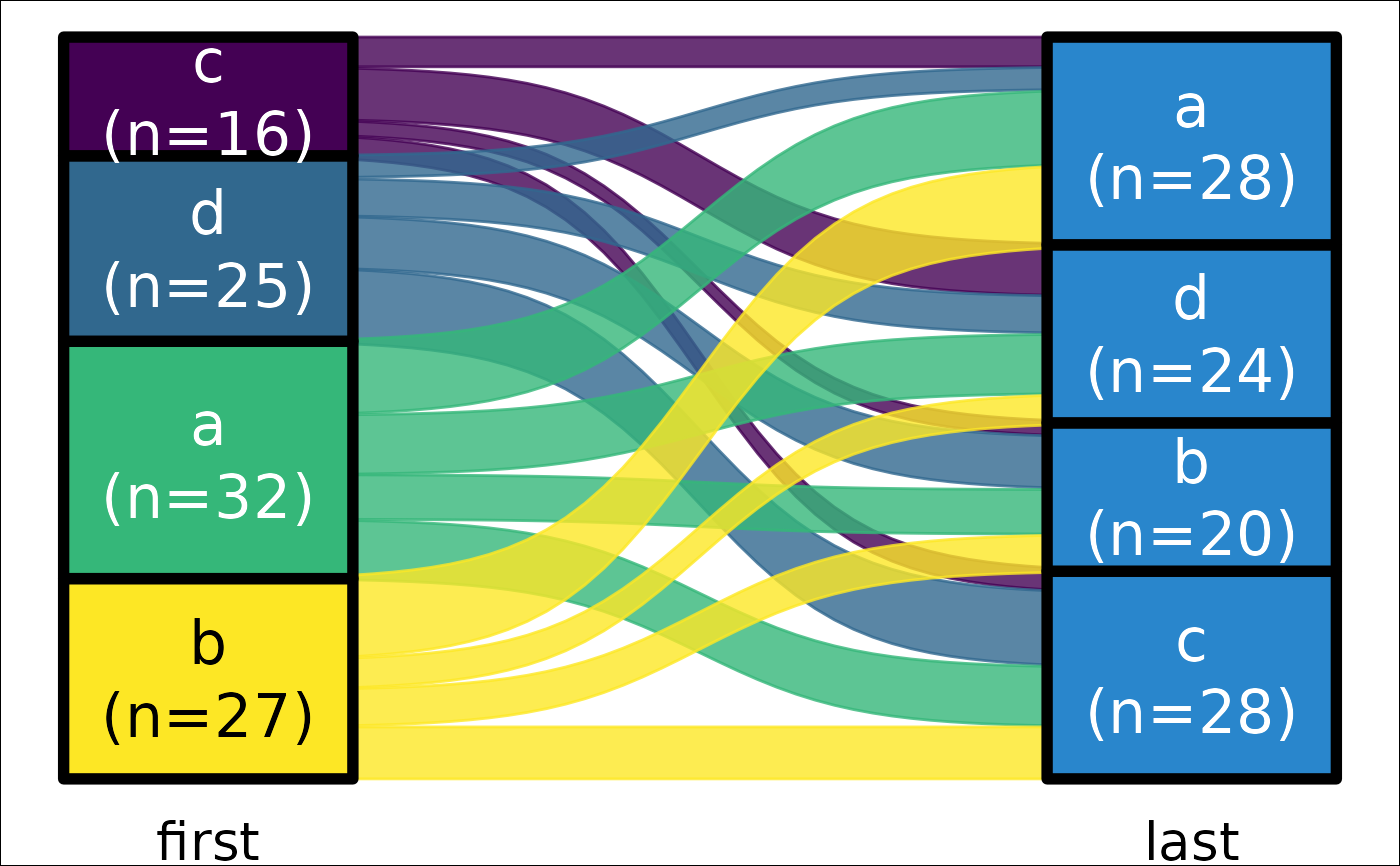 ds |> plot_sankey_single("first", "last", color.group = "y")