Title
Wrapper to create plot based on provided type
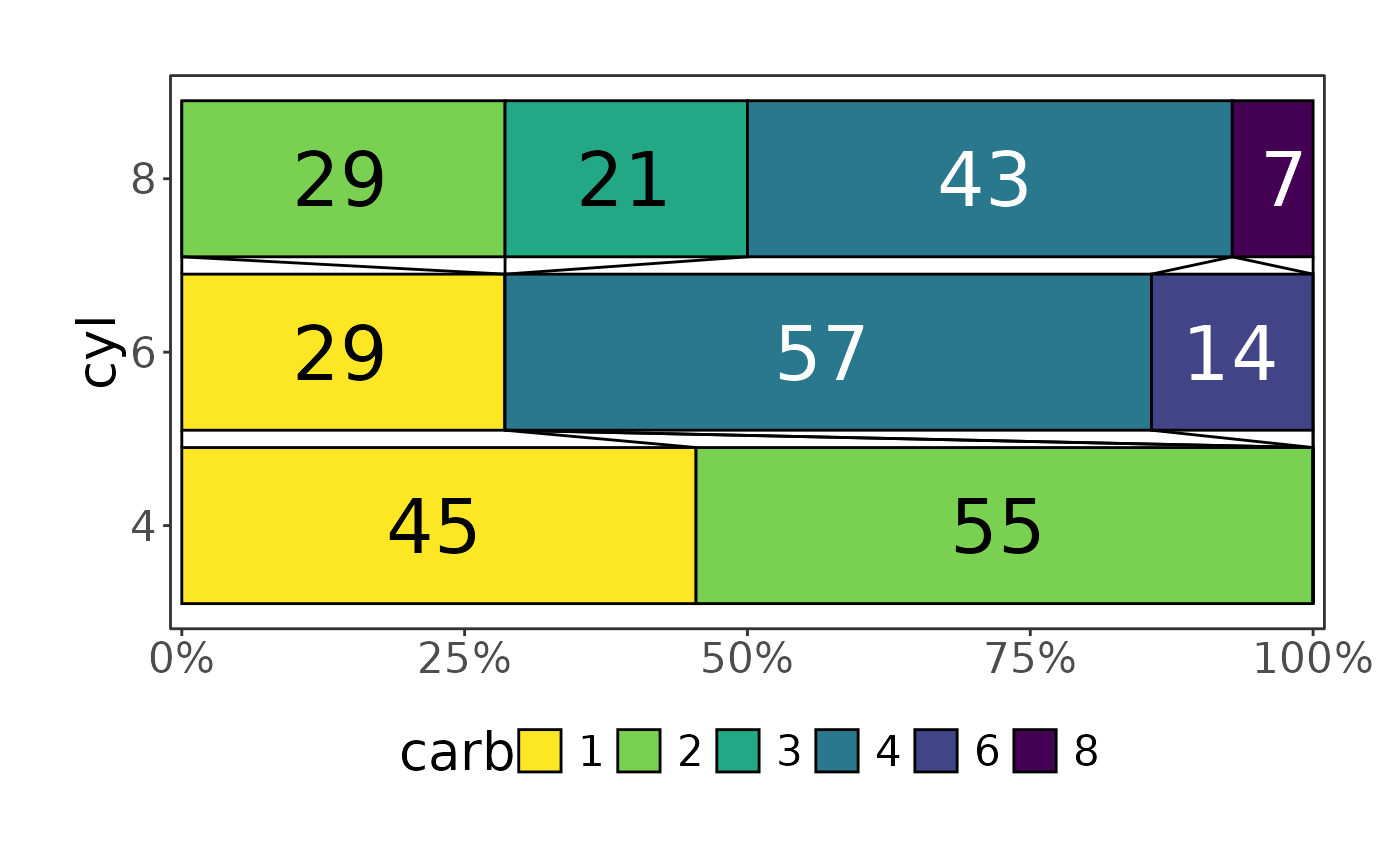
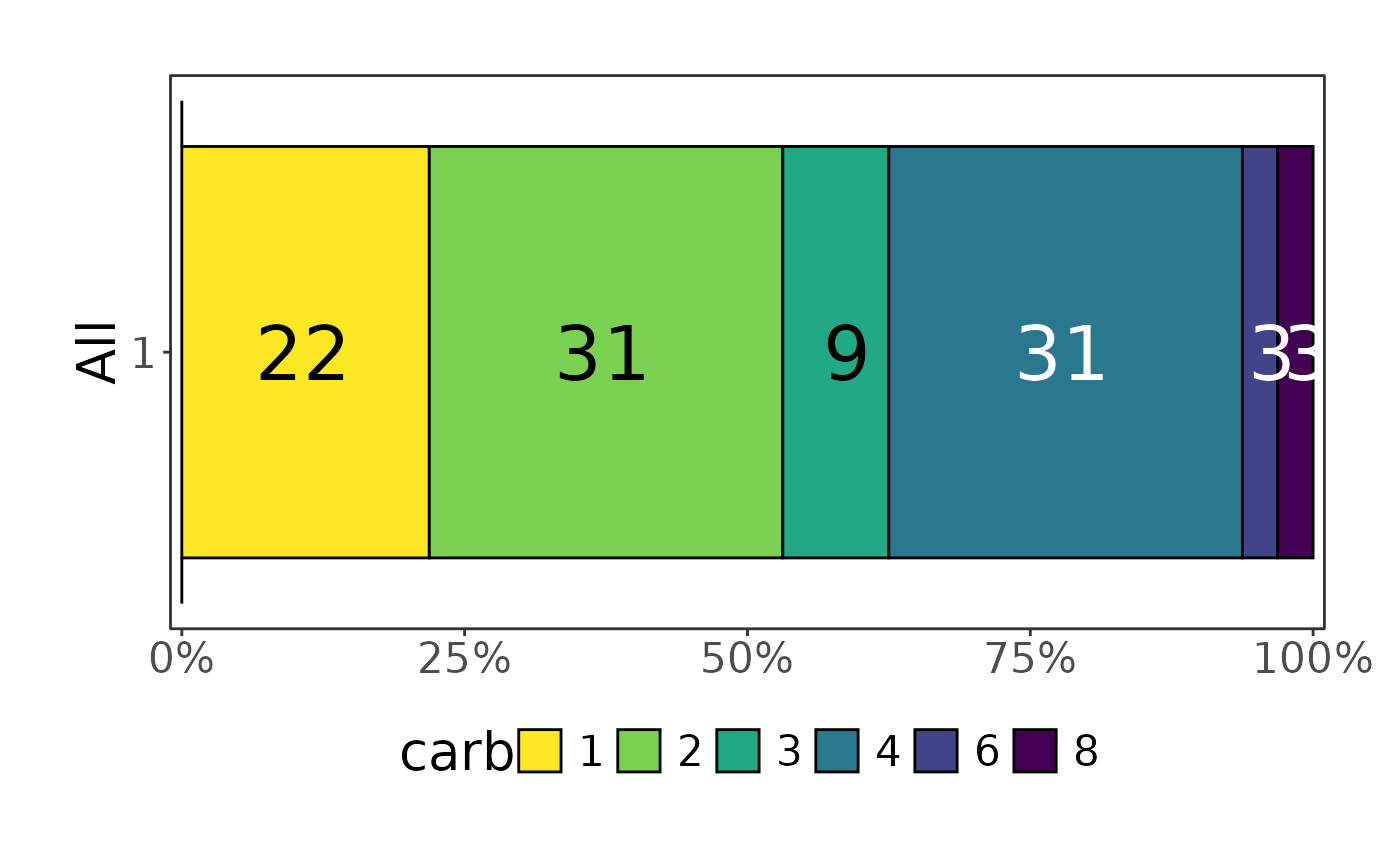
Nice horizontal stacked bars (Grotta bars)
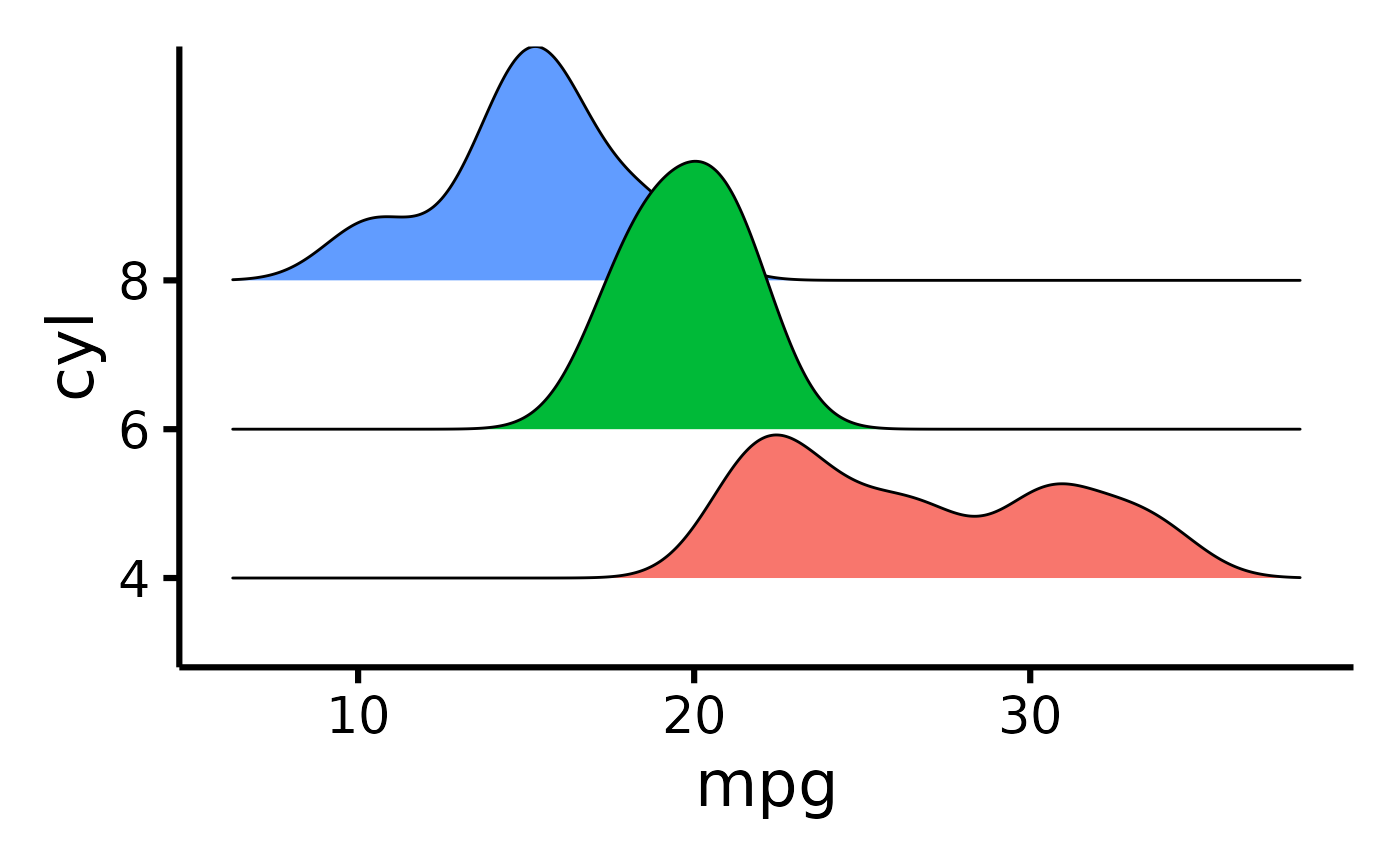
Beatiful violin plot
Beautiful violin plot
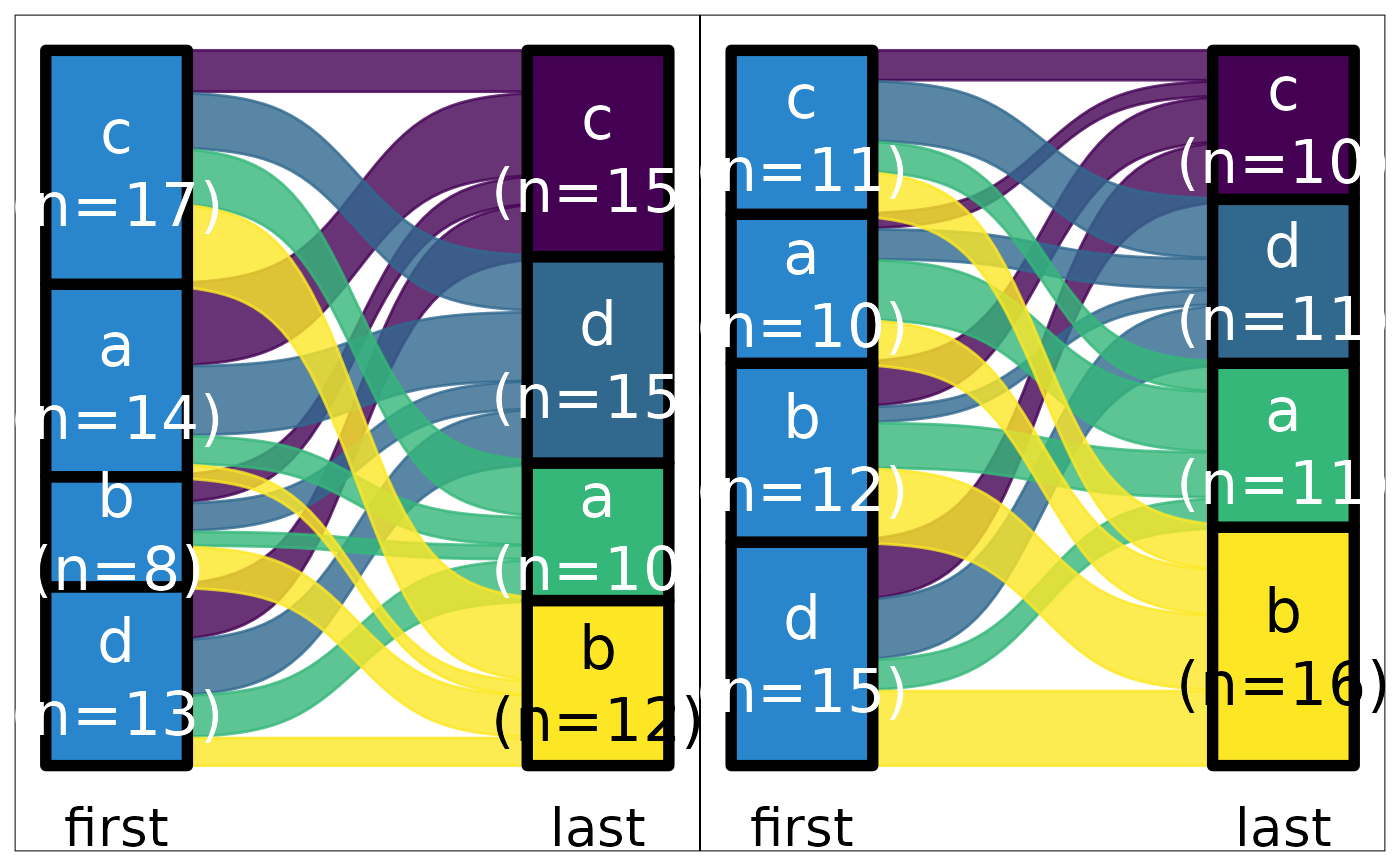
Beautiful sankey plot with option to split by a tertiary group
Usage
plot_ridge(data, x, y, z = NULL, ...)

create_plot(data, type, x, y, z = NULL, ...)

plot_hbars(data, x, y, z = NULL)

plot_violin(data, x, y, z = NULL)

plot_scatter(data, x, y, z = NULL)

plot_sankey(data, x, y, z = NULL, color.group = "x", colors = NULL)Examples
mtcars |>
default_parsing() |>
plot_ridge(x = "mpg", y = "cyl")
#> Picking joint bandwidth of 1.38
 mtcars |> plot_ridge(x = "mpg", y = "cyl", z = "gear")
#> Picking joint bandwidth of 1.52
#> Warning: The following aesthetics were dropped during statistical transformation: y and
#> fill.
#> ℹ This can happen when ggplot fails to infer the correct grouping structure in
#> the data.
#> ℹ Did you forget to specify a `group` aesthetic or to convert a numerical
#> variable into a factor?
#> Error in ggridges::geom_density_ridges(): Problem while setting up geom.
#> ℹ Error occurred in the 1st layer.
#> Caused by error in `compute_geom_1()`:
#> ! `geom_density_ridges()` requires the following missing aesthetics: y.
create_plot(mtcars, "plot_violin", "mpg", "cyl")
#> Error in if (!z %in% names(data)) { z <- NULL}: argument is of length zero
mtcars |> plot_hbars(x = "carb", y = "cyl")
#> Scale for fill is already present.
#> Adding another scale for fill, which will replace the existing scale.
mtcars |> plot_ridge(x = "mpg", y = "cyl", z = "gear")
#> Picking joint bandwidth of 1.52
#> Warning: The following aesthetics were dropped during statistical transformation: y and
#> fill.
#> ℹ This can happen when ggplot fails to infer the correct grouping structure in
#> the data.
#> ℹ Did you forget to specify a `group` aesthetic or to convert a numerical
#> variable into a factor?
#> Error in ggridges::geom_density_ridges(): Problem while setting up geom.
#> ℹ Error occurred in the 1st layer.
#> Caused by error in `compute_geom_1()`:
#> ! `geom_density_ridges()` requires the following missing aesthetics: y.
create_plot(mtcars, "plot_violin", "mpg", "cyl")
#> Error in if (!z %in% names(data)) { z <- NULL}: argument is of length zero
mtcars |> plot_hbars(x = "carb", y = "cyl")
#> Scale for fill is already present.
#> Adding another scale for fill, which will replace the existing scale.
 mtcars |> plot_hbars(x = "carb", y = NULL)
#> Scale for fill is already present.
#> Adding another scale for fill, which will replace the existing scale.
mtcars |> plot_hbars(x = "carb", y = NULL)
#> Scale for fill is already present.
#> Adding another scale for fill, which will replace the existing scale.
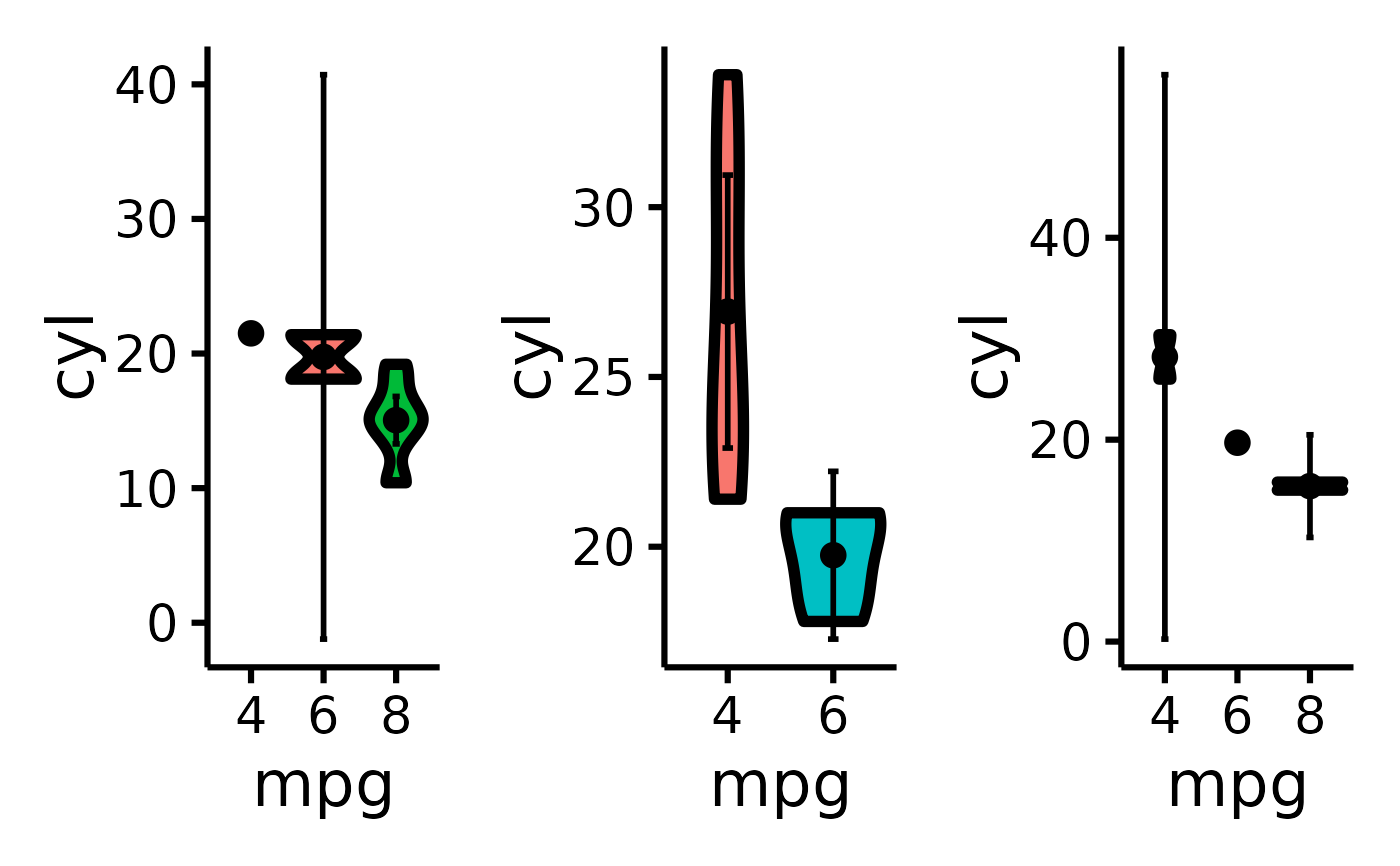
 mtcars |> plot_violin(x = "mpg", y = "cyl", z = "gear")
#> Warning: There was 1 warning in `summarize()`.
#> ℹ In argument: `V1 = .fun(as.data.frame(pick(everything())), var)`.
#> ℹ In group 1: `cyl = 4`.
#> Caused by warning in `stats::qt()`:
#> ! NaNs produced
#> Warning: There was 1 warning in `summarize()`.
#> ℹ In argument: `V1 = .fun(as.data.frame(pick(everything())), var)`.
#> ℹ In group 1: `cyl = 4`.
#> Caused by warning in `stats::qt()`:
#> ! NaNs produced
#> Warning: There was 1 warning in `summarize()`.
#> ℹ In argument: `V1 = .fun(as.data.frame(pick(everything())), var)`.
#> ℹ In group 2: `cyl = 6`.
#> Caused by warning in `stats::qt()`:
#> ! NaNs produced
#> Warning: There was 1 warning in `summarize()`.
#> ℹ In argument: `V1 = .fun(as.data.frame(pick(everything())), var)`.
#> ℹ In group 2: `cyl = 6`.
#> Caused by warning in `stats::qt()`:
#> ! NaNs produced
#> Warning: Groups with fewer than two datapoints have been dropped.
#> ℹ Set `drop = FALSE` to consider such groups for position adjustment purposes.
#> Warning: Groups with fewer than two datapoints have been dropped.
#> ℹ Set `drop = FALSE` to consider such groups for position adjustment purposes.
mtcars |> plot_violin(x = "mpg", y = "cyl", z = "gear")
#> Warning: There was 1 warning in `summarize()`.
#> ℹ In argument: `V1 = .fun(as.data.frame(pick(everything())), var)`.
#> ℹ In group 1: `cyl = 4`.
#> Caused by warning in `stats::qt()`:
#> ! NaNs produced
#> Warning: There was 1 warning in `summarize()`.
#> ℹ In argument: `V1 = .fun(as.data.frame(pick(everything())), var)`.
#> ℹ In group 1: `cyl = 4`.
#> Caused by warning in `stats::qt()`:
#> ! NaNs produced
#> Warning: There was 1 warning in `summarize()`.
#> ℹ In argument: `V1 = .fun(as.data.frame(pick(everything())), var)`.
#> ℹ In group 2: `cyl = 6`.
#> Caused by warning in `stats::qt()`:
#> ! NaNs produced
#> Warning: There was 1 warning in `summarize()`.
#> ℹ In argument: `V1 = .fun(as.data.frame(pick(everything())), var)`.
#> ℹ In group 2: `cyl = 6`.
#> Caused by warning in `stats::qt()`:
#> ! NaNs produced
#> Warning: Groups with fewer than two datapoints have been dropped.
#> ℹ Set `drop = FALSE` to consider such groups for position adjustment purposes.
#> Warning: Groups with fewer than two datapoints have been dropped.
#> ℹ Set `drop = FALSE` to consider such groups for position adjustment purposes.
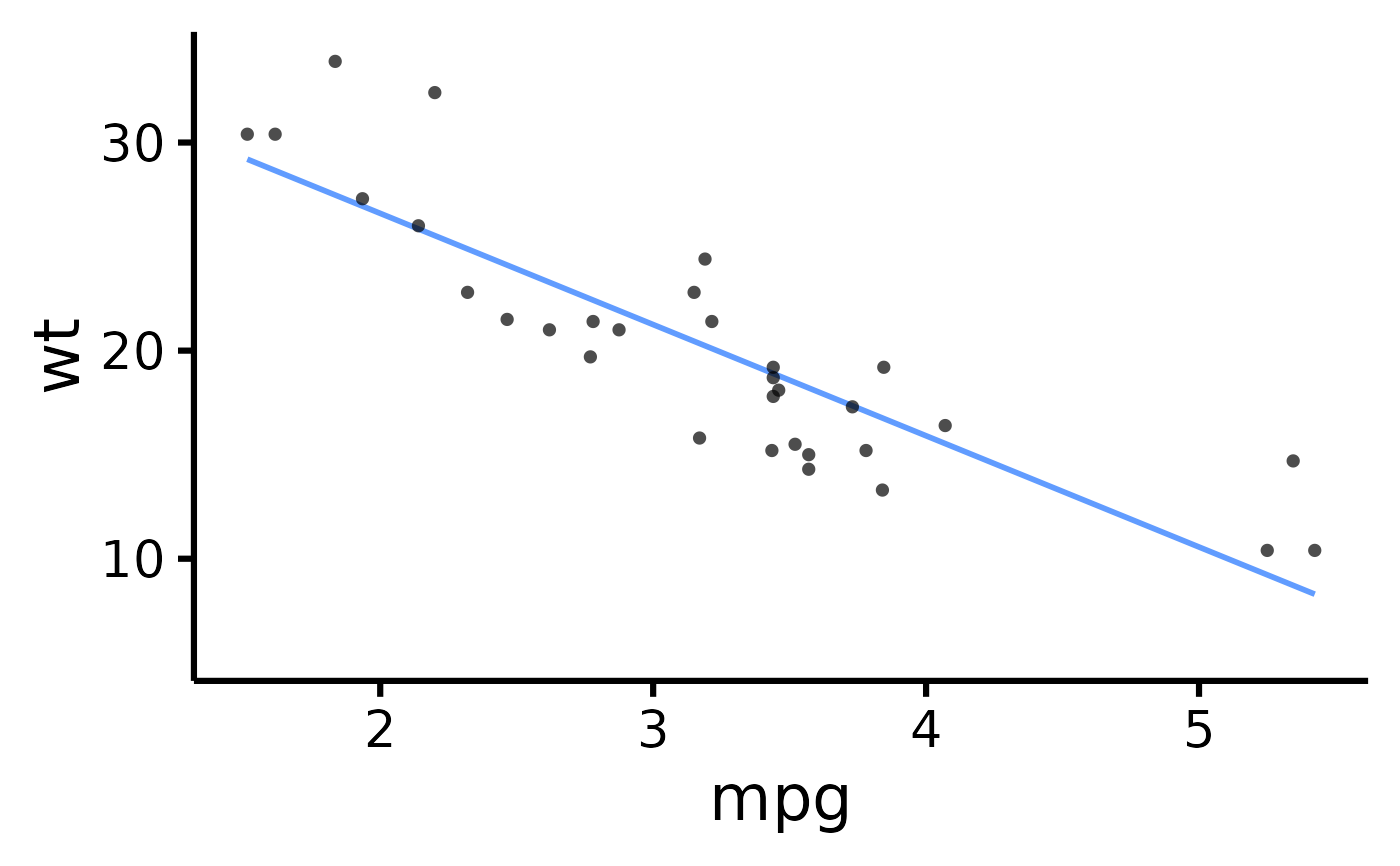
 mtcars |> plot_scatter(x = "mpg", y = "wt")
 ds <- data.frame(g = sample(LETTERS[1:2], 100, TRUE), first = REDCapCAST::as_factor(sample(letters[1:4], 100, TRUE)), last = REDCapCAST::as_factor(sample(letters[1:4], 100, TRUE)))
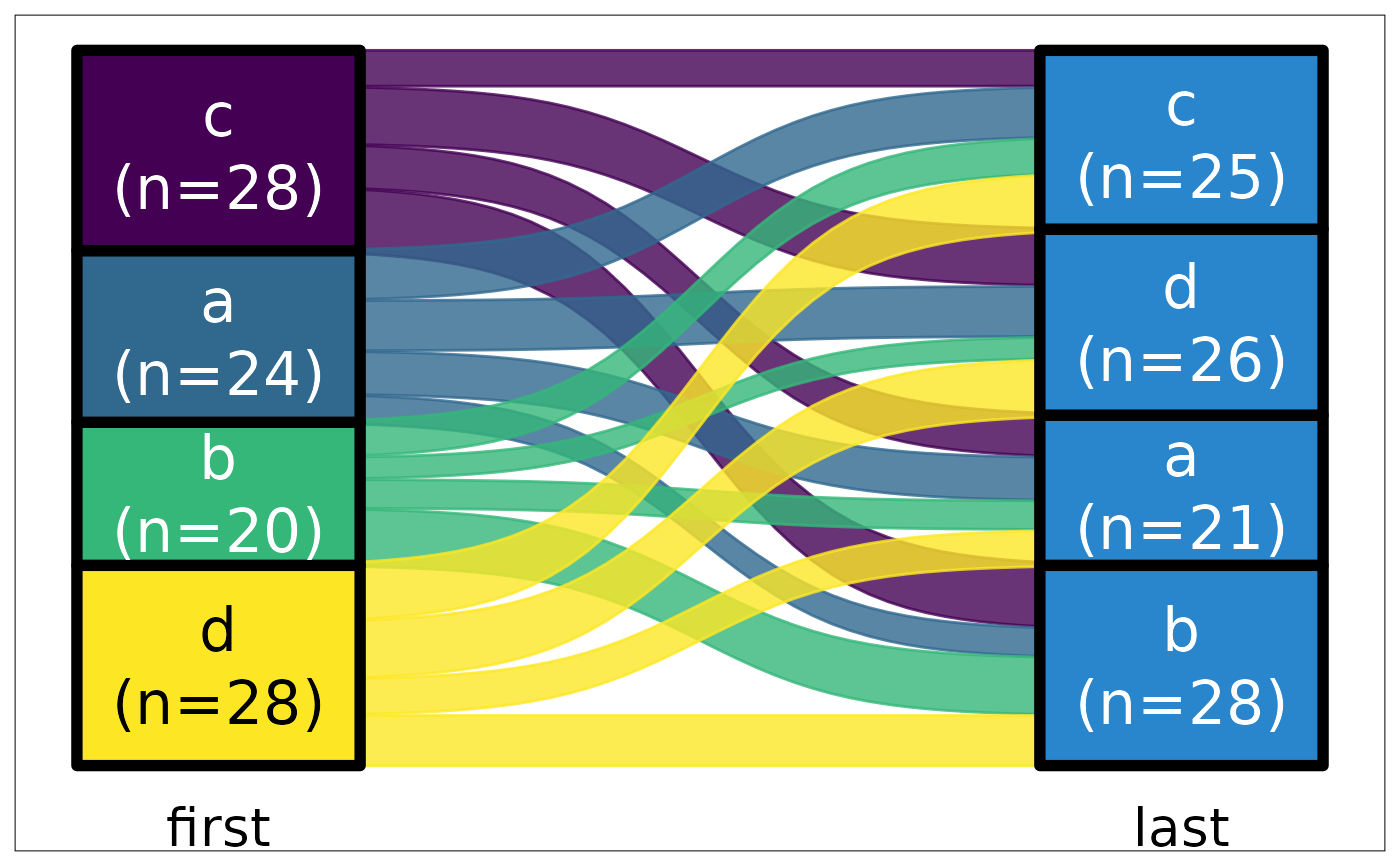
ds |> plot_sankey("first", "last")
#> Loading required package: ggplot2
ds <- data.frame(g = sample(LETTERS[1:2], 100, TRUE), first = REDCapCAST::as_factor(sample(letters[1:4], 100, TRUE)), last = REDCapCAST::as_factor(sample(letters[1:4], 100, TRUE)))
ds |> plot_sankey("first", "last")
#> Loading required package: ggplot2
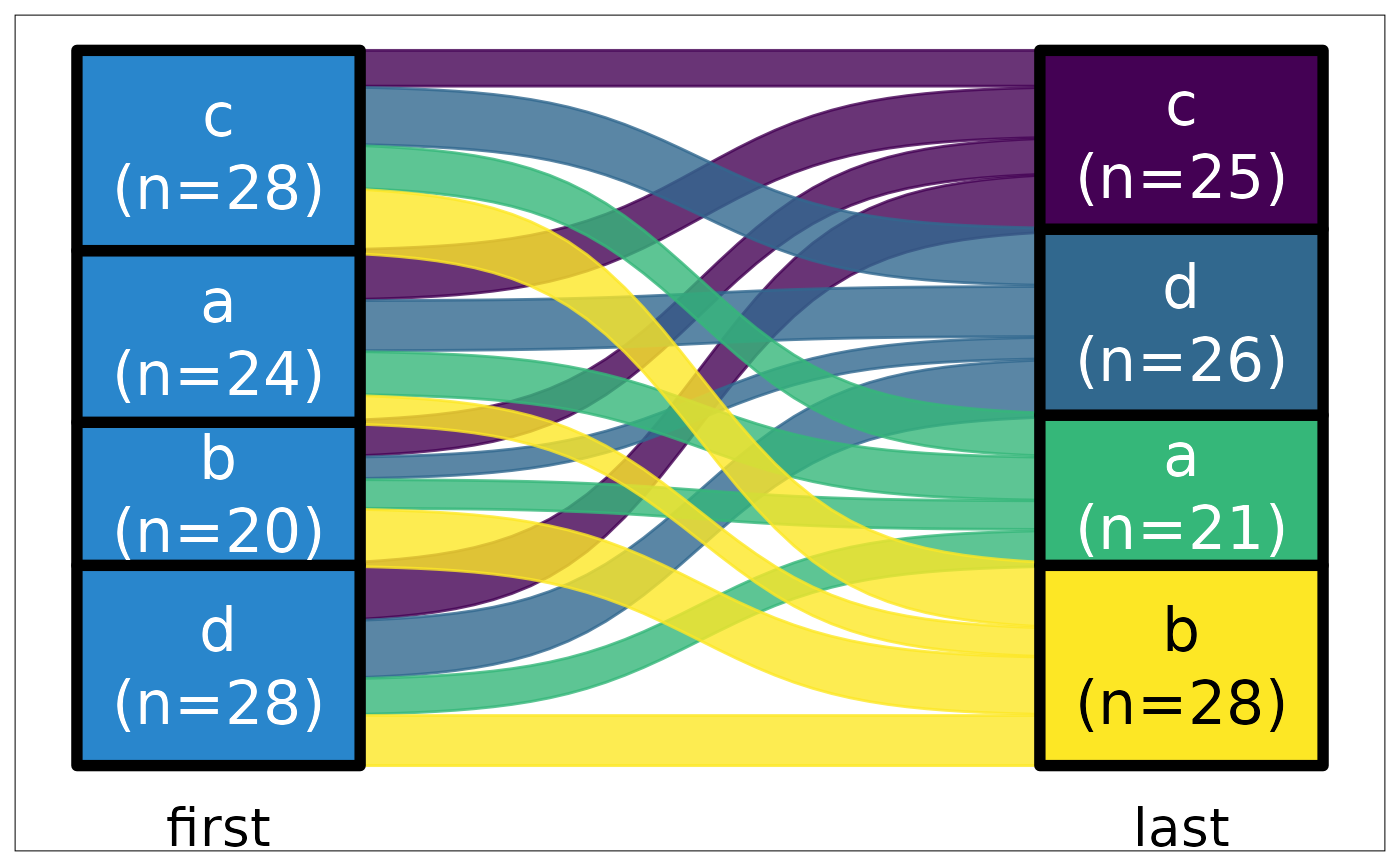
 ds |> plot_sankey("first", "last", color.group = "y")
 ds |> plot_sankey("first", "last", z = "g", color.group = "y")